Using Data for Improvement
Learning Objective: To understand how to use data to guide improvement within your practice and the benefits of doing so.
What is data for improvement?
Data is a vital tool to understand your practice and be able to make lasting, effective improvements. If we don’t measure something, it is difficult to know if we have actually improved. The good news is you do not have to be a statistician to understand and use data for improvement.
The key elements of using data for improvement are:
- Have an aim of what you want to achieve, called an Aim Statement.
- Think of measures which will tell you if you have achieved your aim.
- Generate ideas to implement that will use these measures.
- Collect some data.
- Use the information you have collected to determine what your next step is.
We will go through each of these elements in more detail below.
Why use data for improvement?
Historically, the catalyst for change was a patient or staff member raising an issue. This would result in a change being implemented based off anecdotal evidence. But what if the new change wasn’t actually any better? How would we know? The time spent developing and implementing that change is effectively wasted as it has not improved the process/outcomes. Data for improvement reduces the amount of time spent on implementing ineffective changes and ensures changes which are implemented are having the desired effect. A general practice which consistently uses data for improvement may have smooth and effective processes, resulting in less stressed staff and patients who appreciate coming to an organised and calm practice.
Setting an Aim
An Aim Statement should consider what is it we are trying to accomplish. Without a clear intention of what it is you are trying to improve upon it will be difficult to make changes and improve. The aim should be time specific and measurable.
e.g. Aim to have 6% of our enrolled population on CLIC before the 31 December 2022.
Measurements
Measures allow us to monitor whether we are moving towards our goal. There are three types of measure that we should focus on.
1. Outcome measure: This measure is linked explicitly to the aim statement.
e.g. % of enrolled population who are on CLIC
2. Process Measure: The things which you are going to work on to achieve the aim. Are the steps in the plan performing as planned? Are we on track to improve?
e.g. Total number of patients invited to join CLIC
Number of CHAs (measured weekly)
Number of L2/L3 patients (measured weekly)
Number of Personal Care Plans (measured weekly)
Number of Acute Plans (measured weekly)
Number of Advance Care Plans (measured weekly)
Number of Multi-Disciplinary Team (MDT) meetings (measured monthly)
Number of DNAs (measured weekly)
3. Balance Measure: We use this to see if there are any unintended consequences of our work
e.g. Nurse appointment availability
Nurse task list
Nurse finance generated – is CLIC financially profitable?
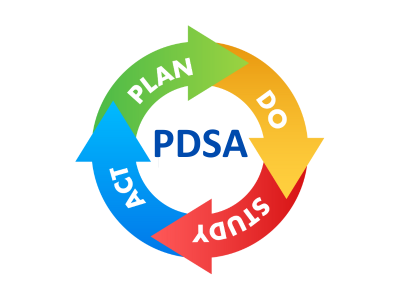
Plan-Do-Study-Act Cycle
Once your aim and measures have been decided upon, you should use the Plan-Do-Study-Act cycle to test if your changes are making an improvement.
Plan – The change to be tested
Develop plan to test the change
Do – Carry out the test
Try out the change on a small scale.
Collect the data as decided on previously
Study – Reflect on the impact of the change, using data.
Set aside time to analyse the data and study the results.
Act – Decide on next course of action
Determine whether to adopt, adapt, or abandon.
Adopt – full-scale implementation of change.
Adapt – make a modification and re-test using a new PDSA cycle.
Abandon – abandon further cycles around this change idea.
Helpful Tips
Careful planning and teamwork underpin all improvement work. Using data is not a replacement for these aspects of improvement.
Data helps to ‘push’ improvement by identifying problems, and to ‘pull’ improvement by identifying opportunities.
It is important to consider how the data will be collected, is it easy to access? The data collection process should be as simple as possible.
Plotting things on a graph can be useful, especially when the data is displayed across a time frame, which allows you to see trends.
If you want more help understanding how to use data, or for help on using tools to display data effectively, reach out to hch@wellsouth.org.nz
Data is not always numbers. Qualitative data such as feedback allows us to gain a deeper insight into an issue and to understand opinions and people better.
It is good to get the whole team involved in generating ideas, but especially those people who work in that area. For example, GPs should not provide the main input to improve the patient enrolment process when that is led by reception/admin.
Mornington Health Centre
Zivana Andrews, Reception Team Leader at Mornington Health Centre, has been using data to increase the number of funded sexual health consultations. Mornington felt they were missing out on claiming for funded services, which means leaving money unclaimed, but more importantly means that patients miss out on, or pay themselves, for services which are funded.
Mornington were unsure where to start, but after looking at their claiming data, it became apparent that with their younger population they should be doing a lot more funded sexual health consultations. It is important to note that this doesn’t mean patients were not accessing sexual health advice, but that Mornington was doing this work for free, or patients were paying for it when it could be funded.
Mornington felt strongly about providing funded sexual health claims, as sexual health affects a lot of younger people, a large part of their population. Morningtons' goal was to increase the number of sexual health claims to the PHO benchmark (expected number of claims for their practice size, divided by the population) of 23 within 6 months. In the 6 months prior to implementation the average number of sexual health claims each month was 3.6.
Zivana said having this baseline data, along with a clear aim, was vital in pushing the practice forward. Mornington developed a new process to ensure all sexual health consultations were processed correctly and gave everyone in the practice the knowledge about who was eligible for a funded sexual health appointment. Mornington also reminded GPs on the process to submit claims through the WellSouth portal.
This enthusiasm soon began to bubble over into other funded services, becoming a bigger project aimed at improving affordability for their patients. One aspect of improving affordability was to maximise the number of funded consultations provided to patients.
Each month at a daily huddle, the team would review the number of funded services they had provided and compare this to previous months. Zivana said this kept the project at the forefront of everyone’s mind and created a sense of healthy competition within the practice.
The data for the six months since Mornington started shows a marked increase in the number of sexual health consults, with an average of 17.1 per month. Other funded services which have shown an increase are CVDRA (average of 47 p/m to 120 p/m) and high needs smears (average of 8.6 p/m to 17.3 p/m). Mornington plan to continue this work.
Zivana said that “without data you don’t have a true gauge of the business” and that although collecting and analysing data seems like a lot more work, it enables you to “improve the business and patient experience”. A lot of what is done in general practice is based off anecdotal evidence, but the facts can be found in the data.